Many Us cities like New York or Seattle make much of their data available for developers to analyze and reveal insights, and they do that through the Socrata Open Data API. In this short tutorial, I demonstrate how to use Socrata to analyze transportation data from New York City and cyclist accidents trend in the city.
Locate the data
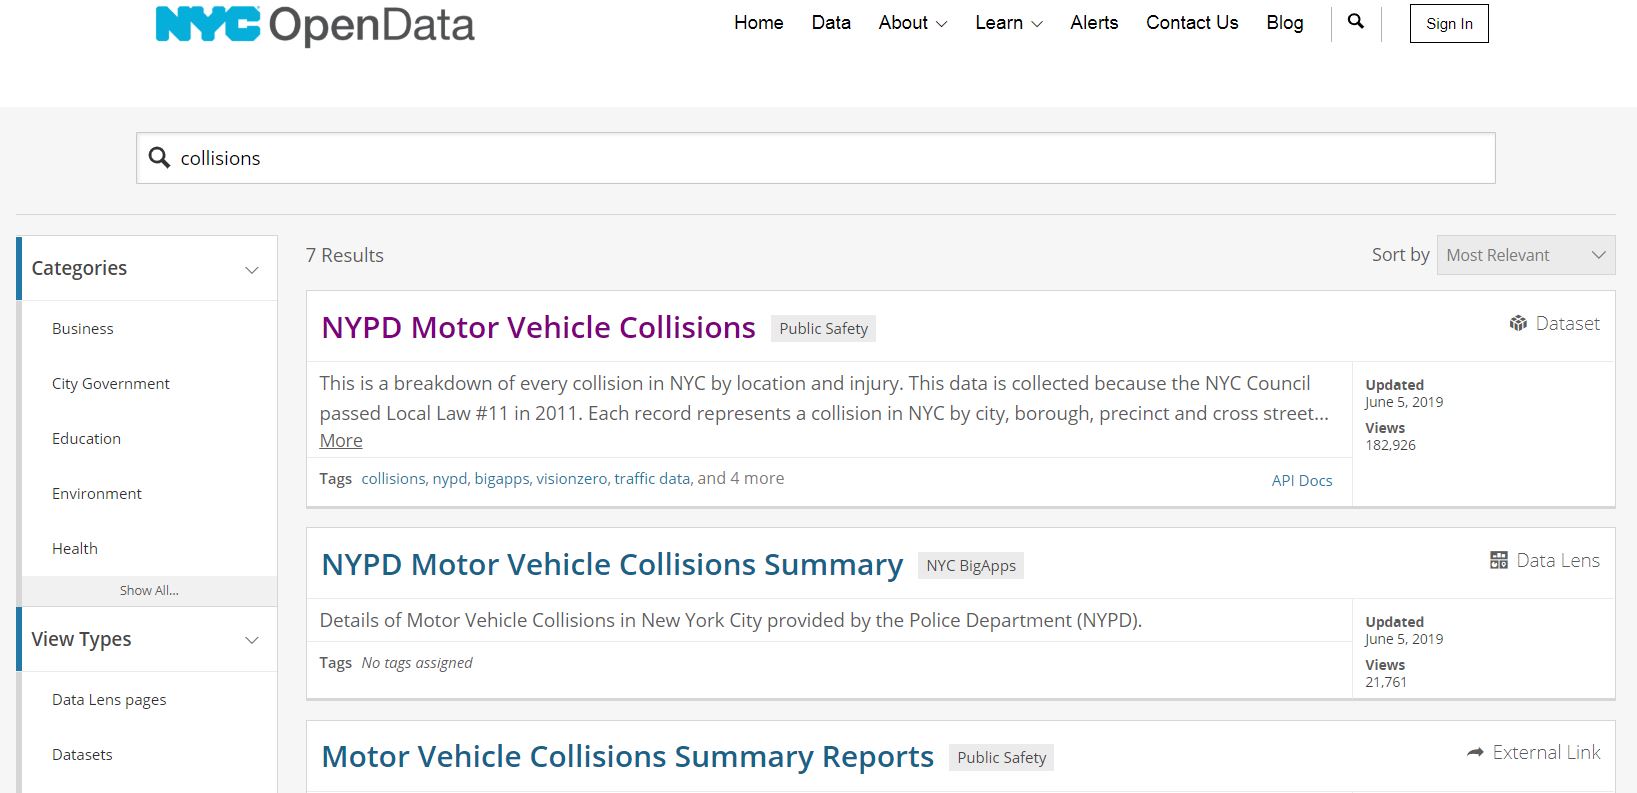
So first, let’s navigate to the Department of Transportation (DOT) data page and search for “collisions” in the search box. The first result we are receiving is NYPD Motor Vehicle Collisions data, a breakdown of every collision in NYC by location and injury.

Going into that web page and scrolling down, we can see it was first created in April 2014. When writing this post, the data contains more than 1.5 million records and 29 columns. Scrolling further down, we can see which columns are available, e.g., date, time, borough, etc. scrolling back to the top, we can see the API button. Clicking on that, and we can see the JSON API endpoint link. This is the link we need to connect and extract the data. Copy it to the clipboard.

Load the RSocrata data
library(RSocrata)
url <- "https://data.cityofnewyork.us/resource/qiz3-axqb.json"
ny_accidents <- read.socrata(url)

# save to rds so it will be available for later
saveRDS(ny_accidents, file="ny_accidents.rds")
Get a glimpse of the data set
library(dplyr)
glimpse(ny_accidents)
## Observations: 1,495,958
## Variables: 30
## $ borough                       <chr> "QUEENS", NA, "MANHATTAN", "QUEE...
## $ contributing_factor_vehicle_1 <chr> "Fatigued/Drowsy", "Driver Inatt...
## $ contributing_factor_vehicle_2 <chr> "Unspecified", "Unspecified", "U...
## $ date                          <dttm> 2012-10-21, 2012-10-21, 2012-10...
## $ latitude                      <chr> "40.6869122", "40.8493533", "40....
## $ location.type                 <chr> "Point", "Point", "Point", "Poin...
## $ location.coordinates          <list> [<-73.79437, 40.68691>, <-73.87...
## $ longitude                     <chr> "-73.7943714", "-73.8711899", "-...
## $ number_of_cyclist_injured     <chr> "0", "0", "0", "0", "0", "1", "0...
## $ number_of_cyclist_killed      <chr> "0", "0", "0", "0", "0", "0", "0...
## $ number_of_motorist_injured    <chr> "2", "3", "0", "0", "0", "0", "0...
## $ number_of_motorist_killed     <chr> "0", "0", "0", "0", "0", "0", "0...
## $ number_of_pedestrians_injured <chr> "0", "0", "0", "0", "0", "0", "2...
## $ number_of_pedestrians_killed  <chr> "0", "0", "0", "0", "0", "0", "0...
## $ number_of_persons_injured     <chr> "2", "3", "0", "0", "0", "1", "2...
## $ number_of_persons_killed      <chr> "0", "0", "0", "0", "0", "0", "0...
## $ off_street_name               <chr> "113 AVENUE                     ...
## $ on_street_name                <chr> "SUTPHIN BOULEVARD              ...
## $ time                          <chr> "11:30", "11:30", "11:50", "11:5...
## $ unique_key                    <chr> "268825", "2929446", "52928", "2...
## $ vehicle_type_code1            <chr> "SPORT UTILITY / STATION WAGON",...
## $ vehicle_type_code2            <chr> "SPORT UTILITY / STATION WAGON",...
## $ zip_code                      <chr> "11435", NA, "10023", "11377", N...
## $ contributing_factor_vehicle_3 <chr> NA, "Unspecified", NA, NA, NA, N...
## $ vehicle_type_code_3           <chr> NA, "PASSENGER VEHICLE", NA, NA,...
## $ cross_street_name             <chr> NA, NA, NA, NA, "PARKING LOT OF ...
## $ contributing_factor_vehicle_4 <chr> NA, NA, NA, NA, NA, NA, NA, NA, ...
## $ vehicle_type_code_4           <chr> NA, NA, NA, NA, NA, NA, NA, NA, ...
## $ contributing_factor_vehicle_5 <chr> NA, NA, NA, NA, NA, NA, NA, NA, ...
## $ vehicle_type_code_5           <chr> NA, NA, NA, NA, NA, NA, NA, NA, ...
the variables with numbers of victims are characters. Lets turn them to integers
ny_accidents <- ny_accidents %>%
  mutate_at(vars(starts_with("number")),funs(as.integer))
Looking at cyclists accident
combining cyclists injured and fatalities
ny_accidents <- ny_accidents %>%
  mutate(cyclists_casualties = number_of_cyclist_injured + number_of_cyclist_killed)

# taking only the casualties column with the data of the accident
cyclists_casualties <- ny_accidents %>%
  select(c("date", "cyclists_casualties"))
grouping by month-year (lubridate does it nicely)
library(lubridate)
cyclists_casualties_by_month <- cyclists_casualties %>%
  group_by(month=floor_date(date, "month")) %>%
  summarize(total=sum(cyclists_casualties))
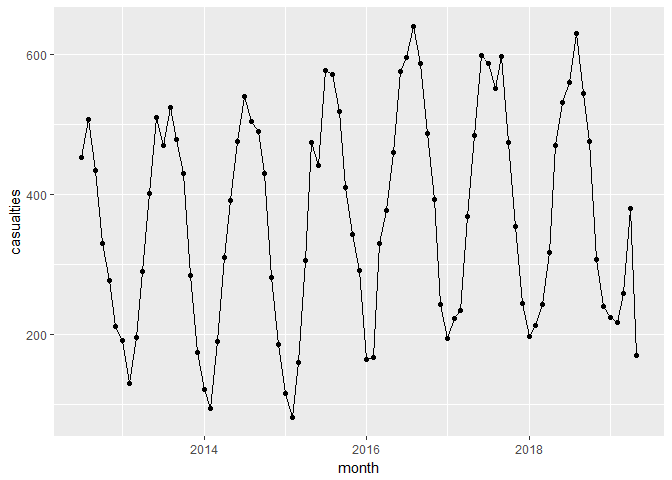
Let us plot the casualties with ggplot2
library(ggplot2)
ggplot(data=cyclists_casualties_by_month, aes(x=month, y=total, group=1)) +
  geom_line()+
  geom_point()+
  scale_y_continuous(name ="casualties")

Important note: We should always remember that each point in the graph represents tens or even hundreds of people whose lives might have been shuttered or even finished instantly. Many casualties were hit by a vehicle cruising in city streets at 50 km/h or more.